 By
By Once upon a time, diagrams were drawn, sent round for discussion and then built by hardware and deployment teams.
It was a slow process and while the diagrams themselves were useful and generated valuable discussion, ultimately they would be stuck inside MS Word documents. Once built, they would not touched until there was a problem.
We now have a world that can use configuration files via APIs to programmatically build infrastructure, which has reduced construction time to minutes rather than months. Infrastructure as code (or more accurately as configuration) is key to this stage of evolution, with tools such as Ansible, Terraform, Chef, Puppet, Saltstack, cfengine and others.
The configuration has effectively become a contract with the cloud, and that contract needs to be shared with stakeholders, such as security people, architects and project managers, as it defines data use, flow and costs.
Our problem now is that this configuration is stuck inside the developer’s source code repository.
Whilst we can share these files, the stakeholders from the other domains need skill and patience to work out what’s gone on. Thus, the actuality of deployment is effectively hidden from the rest of the organisation, be it security, architecture or financial control
What is needed, is a way to share the design, costs and interfaces with the wider IT organisation.
It needs to be represented in a way that is easy for humans to understand and ideally a way to gather feedback.
Digital Design Proposal
To help with increasing understanding, I suggest introducing a modern version of traditional system diagrams. Then use these diagrams to generate the represented system with clouds or generate the artefacts needed for physical implementation.
They should represent system configuration, be sharable among the broader stakeholder group, and be used to create orchestration scripts for straight-through, speedy deployment. Effectively taking infrastructure as code and representing it visually to crowd-source improvements.
The consumers would be security teams, fellow developers, engineers, financial control, even regulators and new roles including micro service coordination.
This proposal would also have an important contribution to scalability and the success of DevOps and agility. It should include software, services and identity as well as infrastructure.
Diagrams of this type can allow simpler construction and a level of implicit configuration. The current situation needs smart people at the top of their game to keep the lights running. However, many contend (somewhat tongue-in-cheek) that there are only a finite number of smart people to go around, so an aid to construction would be welcome by many teams that struggle with the technology overall, especially in keeping excessive costs down.
The Structure
So how do we represent a system that can be simple, comprehensive and intuitive?
One that needs to combine infrastructure, services, user software, system software with configuration? Moreover, how do we include innovations like containers, lambda or functional-as-a-service computing?
The approach taken is to split architecture components and concepts into categories as follows:-
| 1 | Hosts |
|---|---|
| 2 | Software |
| 3 | Services |
| 4 | Clusters |
| 5 | Networks |
| 6 | Network Equipment |
| 7 | Locations |
| 8 | Data Paths |
| 9 | Identity |
Components of different types can be held together in a catalogue for convenience. For example, all the components that a cloud provider might offer (such as hosts or services) would go in to a single catalogue. The catalogue can then be maintained, distributed and included in projects. Switching to a different provider means using a different catalogue.
To describe a general architecture, we use an abstract catalogue that contains generic components that can’t be turned into a real system. When we are ready to commit to a provider and have a notion of the sizes that we may wish, there is a process to convert generics into specifics. The specifics would belong to a catalogue from a provider based on real models they offer.
We use the abstract catalogue in describing the type of components, starting with hosts.
Hosts
The host is a set of processors, memory and storage that is able to run a stack of software and attach to a network.
Hosts range in size and power from large physicals down to just enough cycles to run individual functions. The types can be broken down into:-
| 1 | Abstract host | A host representation that is not mapped to a valid component provided by a catalogue. Can allow portability between providers or deferred decisions |
|---|---|---|
| 2 | Physical host | Whole stack on a physical server |
| 3 | Virtual host | Whole stack on a hosted, smaller, relocatable virtual server |
| 4 | Container hosting | Platform independence and closely allocated resources |
| 5 | Lambda or function platform | A platform that is able to run code functions or lambdas: the smallest useful part of an application triggered on an external event such as the arrival of data or a time mark. |
The graphic of a host is shown below. It shows a software stack, host storage, the host icon, the instance name and a type description.
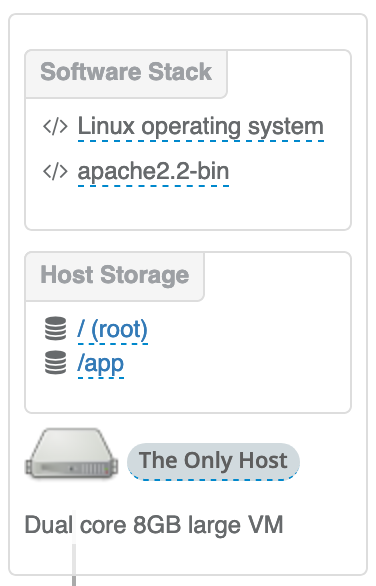
/ (root) and /app.
An additional box attached to a host (not shown), allows us to associate a capability or a service to a specific host. For example, the allocation of an external or internet IP address or a storage back-up service that has host specific settings.
The host types, storage, software and host capabilities are defined by the catalogue.
Software
The software box in the diagram above, holds a stack of software starting from the operating system and following the list order from bottom up to layer software sequentially. This allows control of any side effect that may be caused of desired by the complete ensemble. Each item is a package method supported by the host type and operating system, typically Linux RPMs, .deb packages or Container images (to tun in Docker or Podman).
Each software component can be an explicitly named package in the catalogue, often used for simplicity with common products like operating systems. But it can also a software proxy, where a type of software package is added to the stack, such as an install from git or an https server. The actual software, the location and version can be specified as parameters to the proxy object.
Services
As a complement to hosts, we introduce services.
Whereas hosts are platforms to run software and are customisable, services are complete and defined, implementing a single set of specialist functionality. They have network addresses, possibly implementing RESTful interfaces, RPC or another API. A common example is the DB server offered as a service. You don’t know the patch level or how big it is, but you do know it stores your data and you may be sharing it with others. Another example is a storage device, offering NFS or SMB.
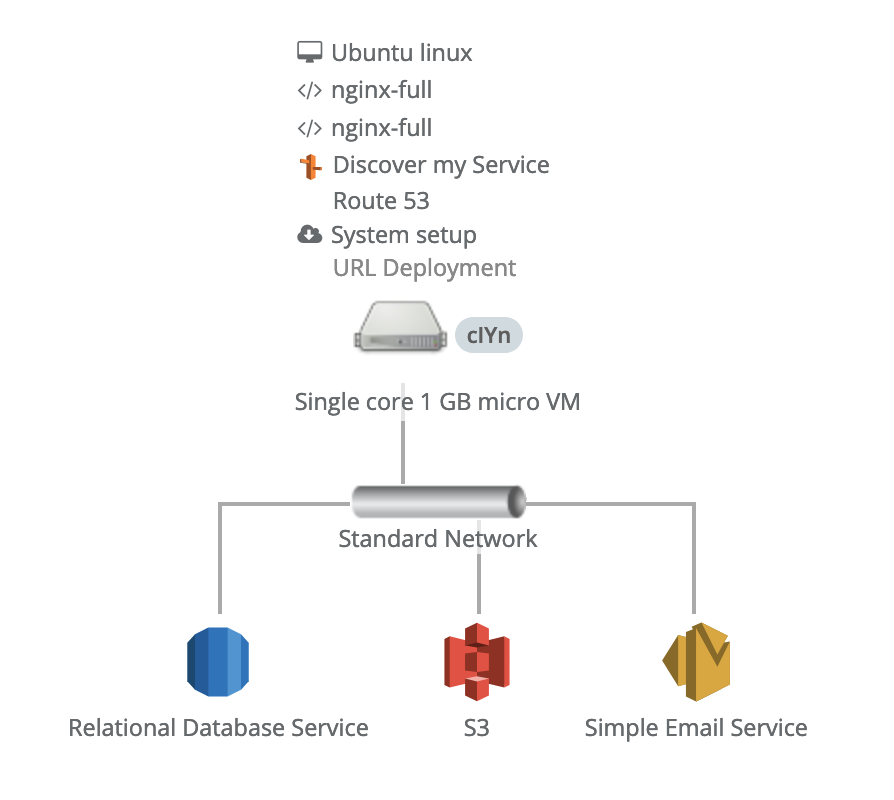
In other regards, a service looks a bit like a host and so is represented as one but without the ability to customise its composition. In the diagram below, services with AWS icons are shown attached to a network, which is shared with a host attached above.
Connecting to a Network
Hosts and Services are always connected to networks.
Sometimes, you don’t care about the details and you need nothing special. The convention is that every point in the design is able to communicate with every other point; they are completely routable. At other times, a specific type of network is offered in the catalogue and can be chosen. For example, a 10 GB and 1 GB Ethernet may be offered and the design may want to use a specific type or even both.
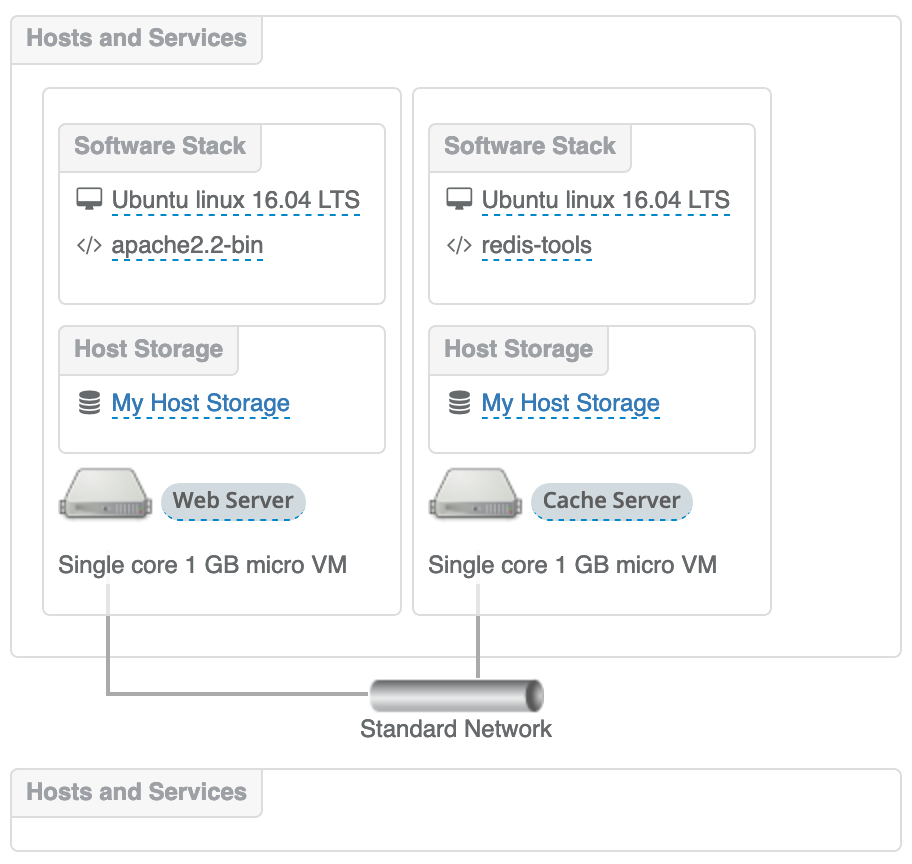
A network component appears as an icon, a description and a name, with dropping regions above and below to place hosts and services. Anything dropped into the regions associates those components with that network device. So, if a set of hosts need to be attached with a fast network but others can be slower, two different network type would be placed on the design and hosts placed accordingly. The faster network technology may be more expensive, so by utilising both, a cost saving may be gained.
By default, a network line is drawn from the component to the network device, which is to aid visualisation and it took like a network diagram. This can be used to make the diagram more readable or to emphasise aspects of the design.
Multiple Networks and the Internet
Regardless of how the lines are drawn (or not, they can be suppressed), it is all one connected (or routable) network; any device can talk to any other device.
We do this by network names. By default every network grouping has the same name and thus they are routed together.
If, however, you wanted to split the network so that they are separate and disconnected, we give the networks different names. Traffic will only propagate to the network groups that have the same names.
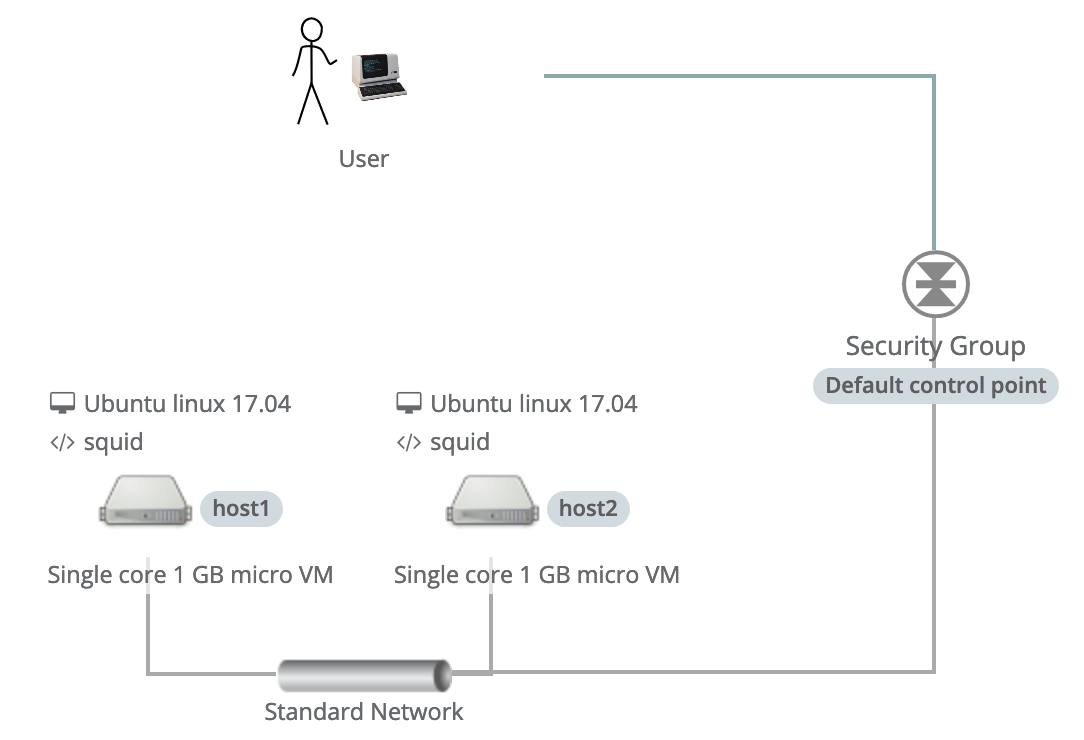
To reconnect groups together with control devices like firewalls or load balancers, we can add network components that represents these devices. The visualisation will then represent this by drawing a ‘jumper’ between networks and the device in question. These can be used to connecting separate networks internally or for attaching your design to the outside world.
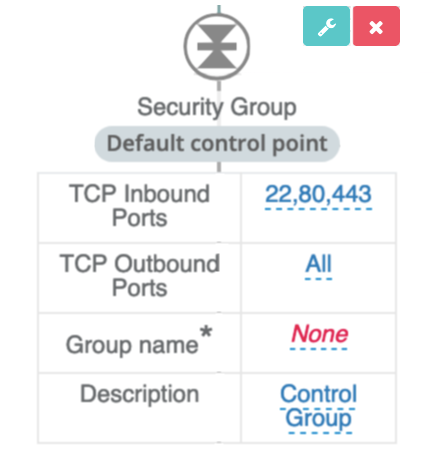
Network Rules
Networking in an enterprise with many firewalls can become difficult for a designer to track. An approach to managing this situation is to make network rules an in-house component of its own and distributed in a catalogue. The networking team can then publish and revise them formally.
One or more rules form a set and can be given names and description like any other component. Within a design, use a stack of rules (like software) in control points/firewalls instead of explicit attribute rules.
Clusters for Resilient and Scale-Out Hosts
In our system of diagrams, hosts can be considered as contracts to execute software; an agreement with the platform provider to run a server of a particular type and configuration. They are logical representations that ultimately may be a single machine, but it is entirely possible that it might be several machines or a highly available compute service.
Listed below are some types of host platform possible with various implicit or explicit innovations:-
| Name | Description | Locations | |
|---|---|---|---|
| 1 | Simple Hosting | Virtual or physical machine in a single location | Single |
| 2 | Fail-over | Using multiple hosts to backup each other for resilience generally with shared storage resources | Single |
| 3 | Host Group | A type of cluster that holds virtual hosts that can dynamically change in size and configuration while deployed, depending on its workload. | Single |
| 4 | Geo Clusters | Similar to fail-over but over multiple locations, introducing additional complexity | Multiple |
| 5 | Container or pods | A platform of one or more physical machines that is able to run multiple software stacks of containers, organised into pods. Multiple machines are often used to maintain high availability and scalability in multiple availability zones or locations | Multiple |
Simple hosting was covered previously. Fail-over could be hidden from you and look like the simple example, or it could be explicitly created by the designer using traditional infrastructure and software techniques.
Host groups, on the other hand, take meta services offered by cloud providers and associates them with a single template host. This template can be used by the cloud meta service to create additional copies of itself and run the same software stack. The system scales the number of hosts depending on external event, such as a timer or load monitor. An upward event or a downward event would trigger the addition of host or their removal.
Host Groups can be represented by a containing box drawn with a chain line to distinguish it from other graphical borders. The template host can then be placed into the box and populated with software in the normal way. The resulting group is treated like a host and can be dragged out as a network client and attached to a regular bus.
Geo Clusters are an extension of the explicit Fail-over clusters, covering multiple locations with shared storage and a mechanism for multi-location networking.
Pod style clusters, such as Kubernetes are represented differently, occupying an entire tier in the diagram (see the next section). A structure representing the pod includes areas for multiple locations, space for pods of containers.
This form of clustering provides a type of PaaS, where the infrastructure implementation is not visible to the designer, only the statement of what is required. The abstraction allows for capacity to be scaled up or down, billing for only the resource used and resilience in one or more locations.
Next Components
In this part, we have covered the essential concepts of the System Garden diagram system: hosts, software, services and networks.
By using the model that these components populate, one can create a new type of technology asset — the architecture as data. It is an asset that can be transformed into multi-purpose visualisations and drive installations; help to budget projects and be used for reconstructing existing businesses.
The next part describes locations, storage, architectural tiers and data paths.
About the Author
Nigel Stuckey
CTO of System Garden
System Garden
Agile Infrastructure for Enterprise DevOps
Design from diagrams, document and deploy to your cloud.
systemgarden.com, Twitter @systemgarden