 By
By In an earlier post, I proposed a system for that would represent many cloud situations and system architectures in a simple graphical form. There are a few more details needed to make a complete system, such as configuration, layout and how resilience should be handled. Also, how to deal with vendor independence without restricting choice.
The additional details start with geography.
Location, Location, Location
For simple cloud deployments, it often doesn’t matter where the service will be located. The most convenient for users and the best price would be the default position.
However, when designs become more critical, geography often becomes a factor. Either to maintain resilience, to keep data close to users in a global context or to comply with legal jurisdictions.
This can conflict with the goals and objectives of some cloud providers. Some give a great deal of location choice, such as Microsoft with a wide range of data centres. Others like Google prefer to give a more limited range of advertised locations but distribute data and execution widely as part of each service. It’s a difference in philosophy that needs to be considered when evaluating vendors.
By explicitly modelling the location in the designs, it puts geography in the hands of the designer as a response to requirements. This will become more important in the future as government’s intervention on data residency or execution venue become greater.
The System Garden diagramming standard represents locations as horizontal columns of components, linking in to the vertical groupings of tiers. This allows similar functional components to show a link across locations in a graphically logical way. For example, a database can show a replication path to its peer in another location in a simple way that aids rapid comprehension.
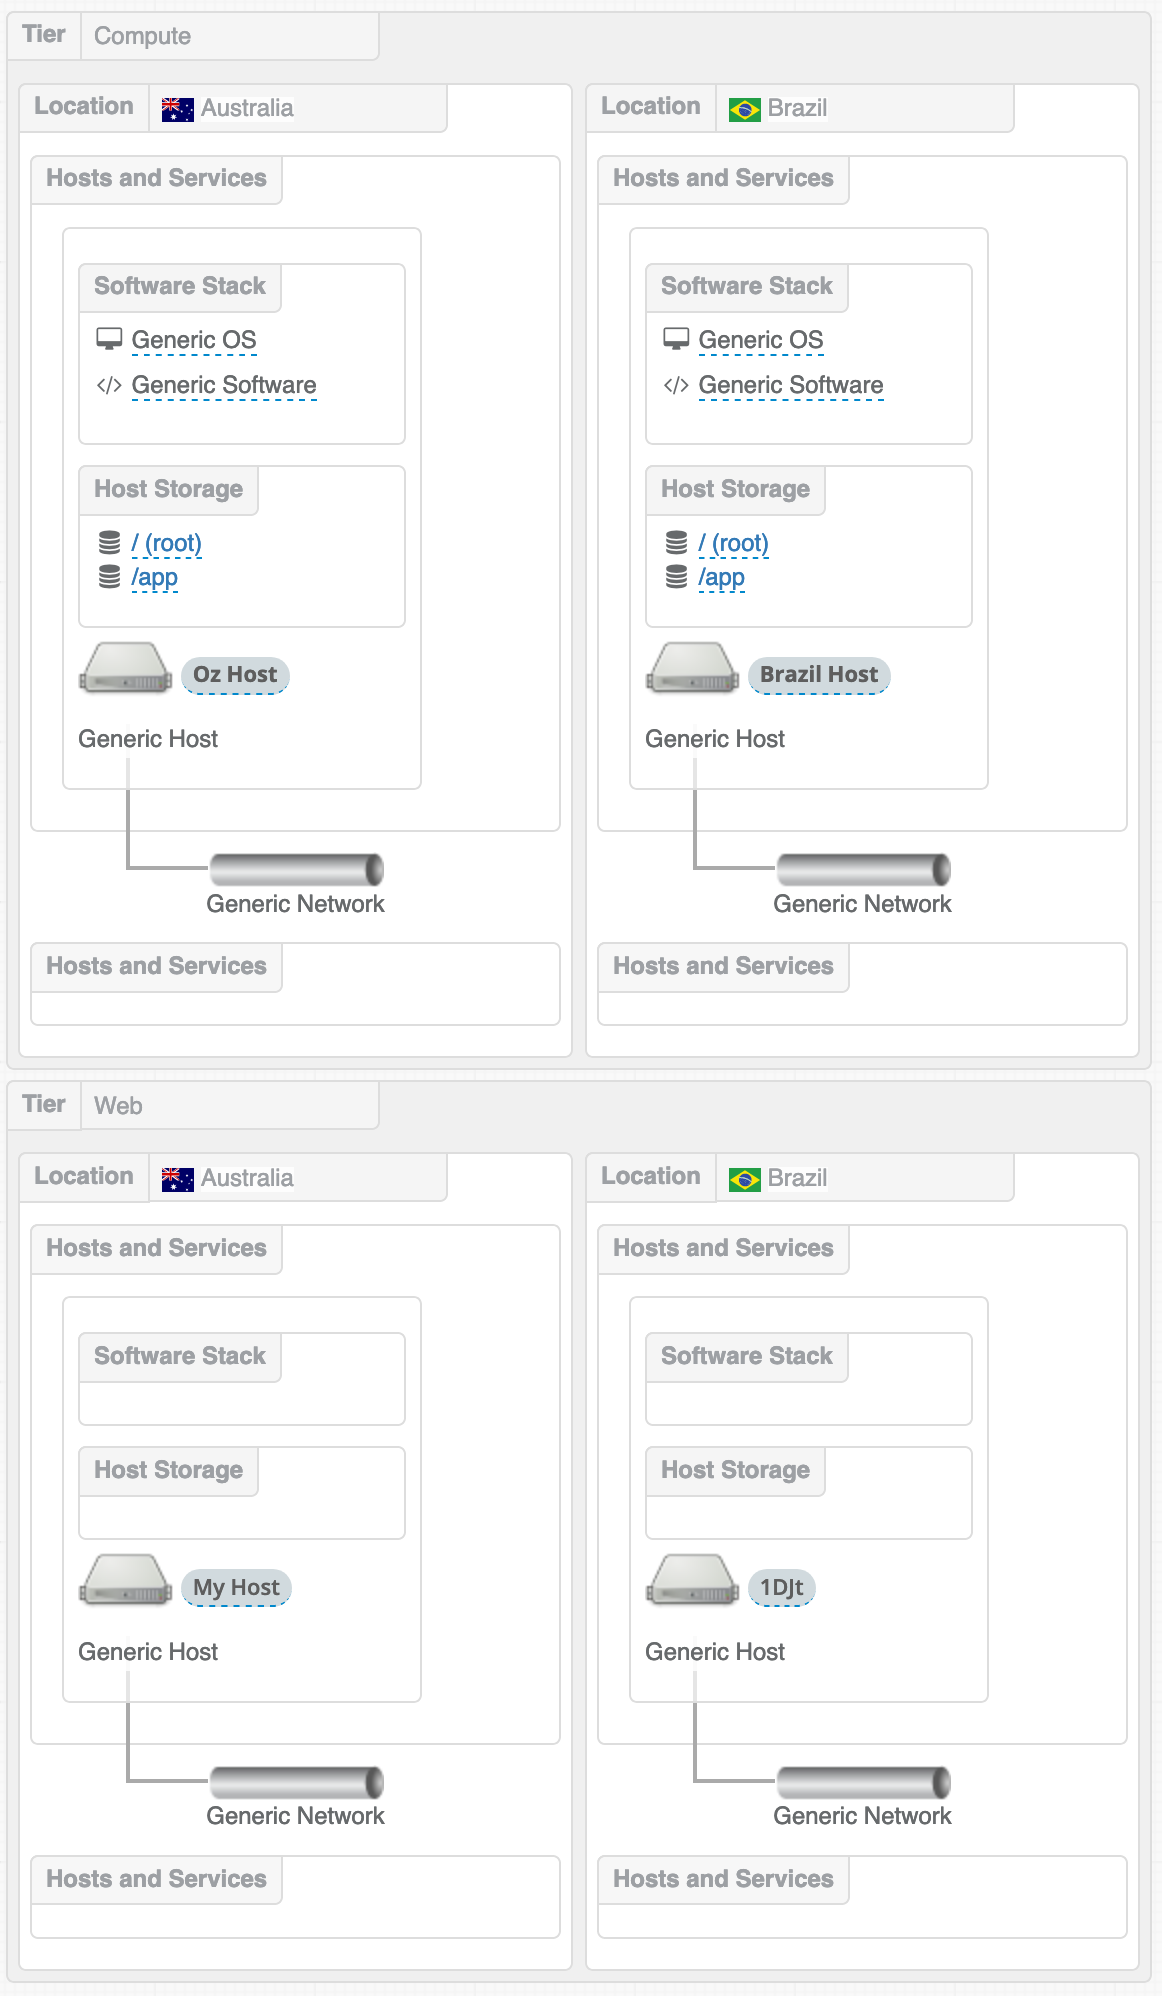
Figure: Two tiers (web and compute), two locations (Australia and Brazil) and a host in each
Different locations can be expressed in different tiers to give the most flexibility when a design needs to show a great diversity of venues. There is no limit to the number of locations in the data structure, but practically showing four across a page is appears to be a practical limit.
Resilience
Resilience in clouds is often different from the practices employed by some industrial sectors, such as finance. But for other industries that haven’t invested in diverse resilience before, the cloud gives a substantial improvement.
Traditionally, resilience has come from a system approach that leaves the application designer to concentrate on functionality. The downside is that it requires substantial investment in redundancy at a hardware level and diverse range of data centres precisely located.
With cloud, the emphasis is on application resilience in addition to some of the more practical and less expensive parts of system redundancy. Instead of synchronous replication performed by storage unit or database, eventual constancy models are popular that synchronise data store over time from a queue. For transactional work, this can be a disadvantage but can be circumvented by using voting style architectures, where an odd number of systems (say three) store the data. The request does not return until data is present in two or more of the systems.
The move to the cloud has not yet seen a single technique dominate. Therefore, a diagram needs to be able to represent both styles mentioned above and more. Either as physically precise locating of systems or a representational view of a service that uses multiple locations under the covers.
Availability Zones
One technique employed by cloud providers, such as Amazon, is the availability zone. These are typically multiple data halls in the same overall location — adjacent buildings in the same site that have different support equipment. They are still fed by the same diverse power supplies and have the same access roads, so there is still some association between them. They give an amount of site independence, but can’t be complete separate.
In our diagram standard, availability zones are shown as separate locations, that are provided in the catalogue for that supplier.
Container Pods and Clusters
Some infrastructure has location resilience built into its service, such as some container pods and some services.
These can be represented in two ways in our diagram:-
- Instances of a service in each of the locations where they are accessed and a ‘peering’ link to connect the instances together. This can also apply to clusters.
- Clusters of hosts and services can also be represented as a complete tier that covers multiple locations, in which case multiple location labels or names can be placed in the fields of the cluster.
Layouts
Another practical issue when drawing diagrams is the layout on the page. Some diagrams are static on a wide canvas, requiring an understanding of size and a viewer that is able to pan around the drawing area.
With the System Garden default method, the components flow like a text document, constrained by horizontal and vertical guides and then superimposed with connecting links. This is the advantage of using visualised data and means that an architectural scenario can be expressed in a web page of any width without horizontal panning or printed page. With a little zooming and adjusting the level of information printed along side, one can customise the diagram to its purpose.
Automatic layout can present some difficulties, especially with overlapping lines, but it gives a great deal of speed and flexibility over fixed-width drawing methods.
Configuration Settings and Catalogues.
All the parts used in a design are held in a catalogue which defines how to deal with a particular vendor. It decides what subset of technologies to use, how to pass parameters to the infrastructure and what to charge to recover costs. It can be self-composed, prepared by a vendor or a bit of both.
Its first purpose is to decide which components are made available to use. This can be driven by the architecture team, who may decide to hold back certain software choices or services to prevent support issues.
The costs of each component are an advisory measure, not a replacement of the vendor’s hugely detailed bill. It enables an overall cost to be set for a technology that includes a recovery for the vendor’s costs and any local expenses such as people, taxes, interest or connectivity. As each component is used in a design, the costs are collected like a shopping basket and once finished give a cost estimate of the overall design. If the design is saved and reused at a later date, one knows the cost impact of the system straight away.
Each component also has a set of parameters that configure its size or behaviour and come with defaults that work straight out of the box. When a catalogue is being created, it is often a trade-off to offer different components or tune with parameters. For example, do you have two components for different VM memory sizes or do you make memory a single parameter?
Vendor Independence
Whilst catalogues are needed to select the components used by a vendor, we can change them fairly easily and therefor change vendor. Its down to the software to transform from one set of components to another with input from the designer to find the closest fit. The vendors do not have exactly the same offerings, in general.
It is also possible to have an abstract component set that is vendor independent. Start your design using the abstract catalogue, which contains representative devices and software, then when you are ready to commit to a vendor switch to a specific catalogue and choose the devices you need. All the catalogues support the abstract design in addition to the specific vendor options, so it is easy to incrementally convert from an abstract state to a specific one.
Design Deployment
Once a design is completed, there are a number of purposes for which it can be used, one of which is to create a deployment.
The same data to build the visualisation is reused to compile a set of instructions for the vendor or cloud system. Each catalogue specifies an orchestration system that can be used to express the configuration steps, such as Ansible, and each component can customise its own details. It is at this point that the configuration items in the design are inserted in the instructions.
The compiled orchestration code is submitted to the cloud system and if successful the returned configuration is available for inspection. If failed, then some part of the design will need amending and the failure is fed back. The design is updated and the process can start again.
Instrumentation
The design can be used as a blueprint to attach graphical indicators, a process known as instrumentation.
Around each component in the visualisation is a set spaces for the indicators, which are call-outs to observation tools. The simplest approach is to be able to have HTLM and Javascript to allow the browser render a view. There are also other types of instrumentation that can displayed from System Garden’s own data.
The Proof of the Pudding
Its one thing reading and looking at pictures, but if you want to see how the System Garden method works in the wild, you can take a look at software that implements it. Head over to https://my.systemgarden.com, make an account, look at the examples and make designs.
A further post will take a look at the specific implementation around Kubenetes and container pods and how they are orchestrated.
About the Author
Architecture, Strategy, Innovation, PM. Follow me on Twitter @nigelstuckey
System Garden
Agile Infrastructure for Enterprise DevOps
Design from diagrams, document and deploy to your cloud.
systemgarden.com, Twitter @systemgarden