Graphical Tools
Habitat's main graphical tool is ghabitat, which can be started by typing ghabitat on the command line or selecting habitat from the start button of the graphical desktop. Data collection needs to be started from the GUI or preferably at system level using clockwork directly. The manual pages towards the end of this user guide show the options that can be used for launching both ghabitat and clockwork the collector. Data collection is discussed in the section above.
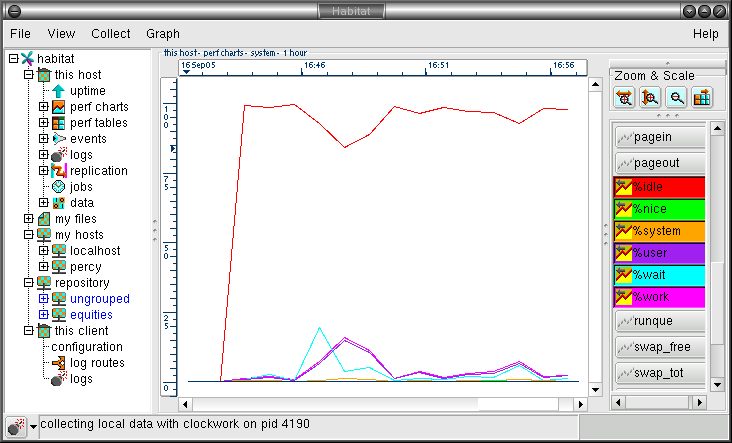
When running normally, a display similar to the one below will be seen, which shows around 12 minutes of data.
Data Visualisation
All manner of data can be collected by habitat. However, the default information displayed in the ghabitat file is shown in the table below
|
Uptime |
When the system was last booted, plus some other information |
|
System |
Key system information, containing the processor and memory statistics. |
|
Symbols |
Entries in the form of key-value pairs that all operating systems generate when they configure |
|
Storage |
Storage capacity and performance |
|
Network |
Network performance |
|
Interrupts |
Hardware interrupts |
|
Events |
The events generated by pattern watching and crossed thresholds |
These choices may be found by following the following path in the choice tree:
habitat->this host->perf charts
More data is collected and this can be seen by selecting the data node in the choice tree. This view is low level and is used when it is important to see uninterpreted data.
An detailed list of the performance metrics and their explanation is help in an appendix
Data In Charts or Graphs
In the current version of habitat, performance data is charted when perf charts is selected from the choice tree. Once selected, the performance data choices (shown in the section above) appear as branches.

Once the leaf node in the choice tree has been chosen, the visualisation pane will change from the current display (which may be the splash screen) to a chart holding data values and a set of visualisation and navigation controls. A default set of data curves are displayed, which may be changed by using the controls to the right of the chart area. The manipulation of the data is explored below.
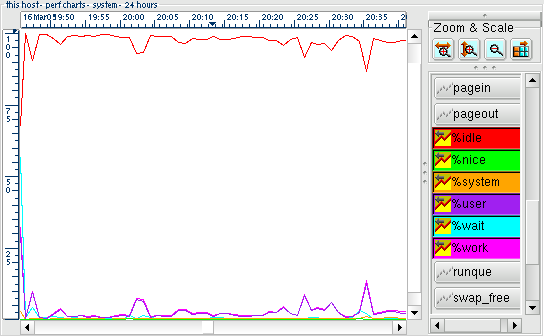
Please note that the chart will be updated periodically whilst it is displayed. The frequency of update depends on the time scale chosen and can be updated manually with the ^L key or the menu bar choice View->Update View. Data is appended to the current view.
Data In Tables

In the current version of habitat, performance data is displayed in a table when perf tables is selected from the choice tree. Once selected, the performance data choices (shown in the section above) appear as branches. This is identical to the display of data in a chart as shown above.
Once the leaf node is chosen, the visualisation area switches to a tabular display of the selected data. Moving the mouse pointer over the column title will cause a pop up to appear with an explanation of each data attribute (where given).

The data can be panned horizontally and vertically as expected using the scroll bars.
Data In Row Popups From a Table
Some times it is useful to see a row of data as a column, especially when dealing with many wide columns. By double clicking on a row in the tabular display of data, a column of data is displayed in a separate pop-up window.
Additionally, it is also useful to see one row of data whilst looking at another, which may not be easy to out of the table context.
Pictured below is an example from the system probe, where two popups taken from different rows are shown next to each other.

Data Navigation
Finding Data Sources
The choice tree, held in the left-hand area of the ghabitat tool, represents many of the features of habitat and each time one is selected, the visualisation area will be changed to show that data.
The first level of organisation is shown in the diagram below, showing a compressed view of the tree's top level.
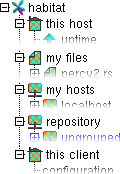
The nodes are as follows:-
|
this host |
Information coming from the local host, via the network connection to clockwork. If clockwork has been configured to disable network requests (clockwork -s) or if a private instance is use, then this node will not be populated and the data may be accessed by file under my files |
|
my files |
Files that can be read by ghabitat will be placed under this node. Open them with the menu bar option: File->Open and formats that can be read include ringstore, CSV and plain text. Files may be closed with File->Close from the menu bar and will be remembered next time ghabitat is run |
|
my hosts |
Hosts accessed using the option File->Host from the menu bar will be placed under this node. Two type of access are possible: direct, which gets data from the monitored machine and repository, which obtains data indirectly from an archive |
|
repository |
If a repository is configured (see appendix and Administration Manual) then this node will be populated with the organisational hierarchy taken from the harvest repository. Navigate through the organisation tree to find the host entries |
|
this client |
The workings of the ghabitat client being used. Currently holds the configuration, log routes (log destinations) and the logs directed to the local client |
Each of these choice tree paths will reach a data source, such as a file, a host, repository entry or meta source. If the choices are dynamic (itself driven by data), then the entires are coloured blue and may be updated with View->Update Choice option from the menu bar or the F9 key. Automatic updates will occur periodically.
Source Exploration
Each data source provides arbitrary entries, which may be used to expand the functionality of habitat. However the following section describes the sources which identify themselves to ghabitat as conventional and have meaning to the habitat suite.

The tree above shows a typical list of the sources visible from each full data source, such as a ringstore. In the example above, it is the local machine that runs your ghabitat and named this host. Each release of habitat is likely to alter the organisation of choices as functionality is optimised. An explanation of the nodes are as follows:-
|
uptime |
The amount of time that a system has been running |
|
perf charts |
Performance data visualised by charts |
|
perf tables |
Raw performance data shown in tables |
|
events |
Events from monitoring data for patterns or thresholds |
|
logs |
Logs generated from the running of data collection jobs |
|
replication |
Replication state and logs when enabled with a repository |
|
jobs |
Job table, used for clockwork |
|
data |
Raw view on all the data stored |
Not all the nodes at this level will be populated. For example, if there was no replication taking place, the entries for it would not appear in the tree. If the ringstore was not generated by the standard clockwork job table, then it is likely that only the performance data would be shown; the job table causes many data sources to be run and collected in the same datastore. Flat or CSV will typically have only two choices, corresponding to charts and tabular viewing.
Once a source has been selected, the section below shows how the view can be tailored to show the correct data set.
Changing Timescales
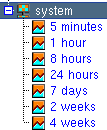
Each row collected by habitat has an associated time stamp. When examining the data source, ghabitat pre select typical data views based on time scales. These are typically values such as 5 minutes, 1 hour, 24 hours, 7 days, ranging all the way to 30 years. The more history there is in the data source, the great the time scale to display it.
When one of these time scales nodes are selected, a corresponding chart or table view will be drawn. Clicking on different time scale nodes in the choice tree will cause different amounts of data to be displayed. Note that the greater the time viewed, the longer it will take to retrieve from the source, the more memory used and the busier the display.
See the Zooming section to customise the views or look at interesting parts of the chart.
Selecting Curves
When viewing a chart, the visualisation area is split into three boxes, all of which are resizeable. The main one contains the chart itself, framed by a heading and rulers showing time and value. The smallest box contains buttons used for zooming and scaling (see the later section), leaving the remaining box which contains the curve list.

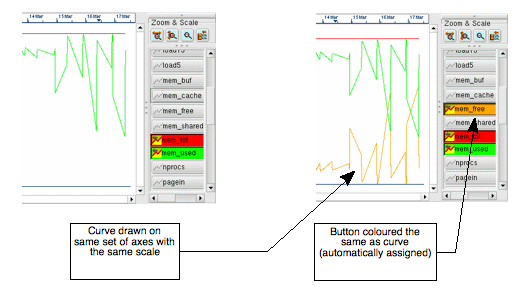
The curve list is a scrollable set of buttons that control what is drawn on the chart. Each column in the collected data may be turned into a plotted line, providing it has numeric values. Hovering the mouse pointer over a button will return the attribute's information in a tooltip. Clicking on a button changes its colour and icon and a line is drawn on the chart in the corresponding colour.
Illustration
7: Before and after: drawing a new curve on a chart with an existing
set. A colour is automatically assigned and used to draw the curve
line and tint the button for identification
To remove the line from the drawing, click the
button to deselect.
When a standard choice is selected, a default set of curves are drawn. However, when the curve selections are changed, it will be remembered when the choice is shown again or the same view is shown in another data source.
Zooming and Panning Graphs
One of the most useful parts of ghabitat is the ability to zoom into a displayed graph and for the rulers to be intelligently redrawn at the right scale.
There are four ways to achieve this:-
-
Drag the mouse pointer over the interesting part of the chart whilst pressing the left mouse button. A box will be drawn over the area which should be clicked inside, again with the left mouse button. This will redisplay the graph using the dimensions of the box. The current aspect ratio will not be maintained, so that it is possible just to expand the time scale, whilst leaving the full range of values on the y-axis
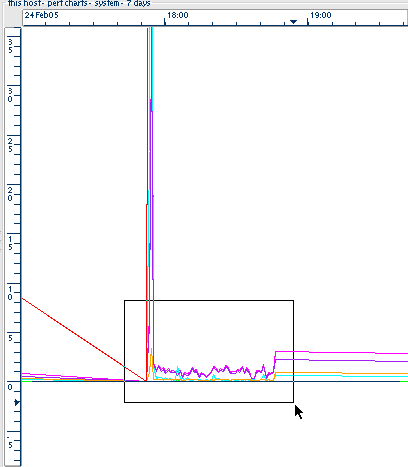
Alternatively, click on one of the two zoom buttons in the Zoom & Scale box. These will increase each dimension (the x or y axis independently) by around 50% and position the display in the middle of the previously displayed values.

Select one of the menu bar options:
Graph->Zoom In->Horizontally or
Graph->Zoom In->Vertically, which will perform a similar function to the zoom buttons.Use the keys:
+ to zoom in horizontally by 50%
^ to zoom in vertically by 50% and
- to zoom out

Once the display is zoomed, one may pan around the chart using the horizontal or vertical scrollbars. Selecting or deselecting curves whilst zoomed will not cause the scale or position to be reset: new values will be superimposed with out resetting the current view.
To zoom out, either click on the right mouse button, or select the zoom out button. Either of these will zoom out of the current view in both dimensions by about 100% each time. Clicking the right mouse button or zoom-out GUI button:
![]()
several
times will result in the display being returned to the full view of
the chosen time scale.
Adapting Curves
Some attributes have such large values that the y-axis is unable to cope with the sheer length of the labels. Alternatively, if two attributes are drawn with radically differing values, all the contours of the smaller valued curve will be lost in a flat-ish line at the bottom. Examples are shown below

Illustration
8: Two examples of problems when using curves with large values. The
image on the left showing a flattening of the smaller valued curve
and on the right being too big to place values on the y-axis
For both these situations, ghabitat has the ability to alter the scale and offset of any curve, using the formula:
y = m x + c
which
most readers will remember from school mathematics: m
is the scale, c
is the offset on the y-axis. To activate, click on the 'extra fields'
button in the Zoom
& Scale
box:
![]()
This will cause the curve selection list to expand, similar to the list below:
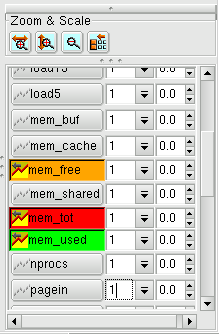
Locate the scale field of the curve that you wish to make smaller, and type in a magnitude less than 1.0 or use the pull-down to select a predetermined power of 10 (initially the best approach). The graph rescales with the values of the big curve reduced to manageable proportions. Other curves squashed down at the bottom are able to expand and show their contours compared to the giant.
The diagram below shows one of the previous examples but scaling the pageout data by 0.01 (dividing it by 100). The two curves fit into the same scale and can be displayed on the same chart without loss of detail.
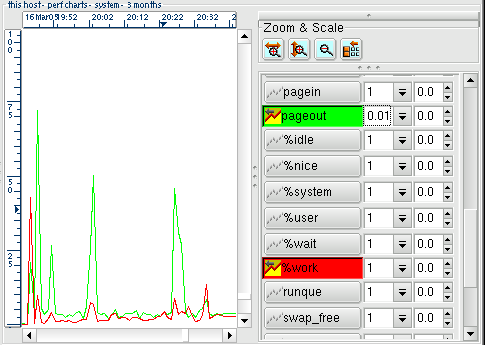
In illustrating performance issues, it is very useful to show a small scale item such as % cpu utilisation (maxima of 100) on the same chart as memory usage (which may have a maxima of 32,000). Scaling the memory to a factor of 0.01 or 0.001 (100 or 1,000 times smaller) would achieve this and is shown in the example above.
In addition to scaling, an offset may also be applied to the values of the curve. The offset moves the curve vertically against the y-axis.
Clicking on the 'less fields' button:
![]() hides the scale and offset columns from the curve list.
hides the scale and offset columns from the curve list.
Custom Graphs
Custom Graphs are not currently in operation
Selecting Instances
Some rings involve multiple instances, such as storage or networks where the data describes multiple devices. For example, individual network interfaces or storage devices. When these rings are displayed, the selection list is joined by a scrollable instance list or check boxes. By default, the first instance is selected.
Selecting additional instances splits the chart display area evenly and draws graphs of the chosen items in each. Clicking on the curve selections draws and erases the lines on all the split graphs simultaneously.
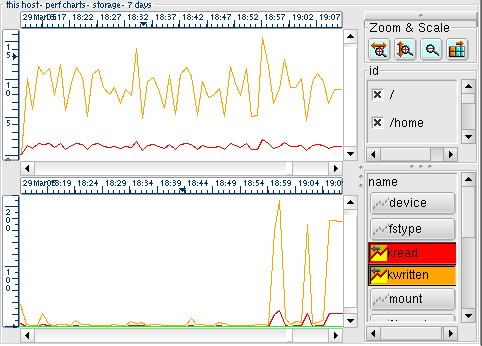
Illustration
9: Two instances are chosen from a storage ring: / (root) and /home,
resulting in two sets of graphs. Each is drawn with two curves:
kread and kwritten to show the volume of data transferred in both
directions
Instance graphs are removed when the corresponding instance is deselected.
Import and Export
The conventional format for information within ghabitat is the ringstore, but data can also be directed to other formats and uses.
When data is displayed with a graph or in tabular chart form, it can be sent to other users by e-mail. The format will be Comma Separated Values (CSV) or Fat Headed Array (FHA) with options to alter information's appearance. Select View->Save Viewed Data... from the menu bar and the following pop-up will appear:
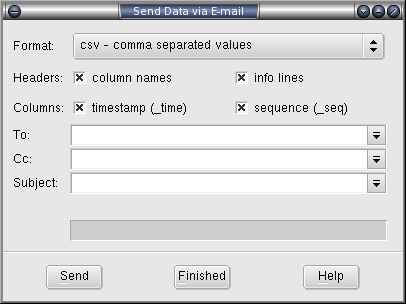
Two formats are currently available from the Format: widget as described above. The selection boxes in the Headers: line govern the printing of column names and info lines, the latter of which may be multiple lines terminated with the special '--'. Columns: select the printing of the _time and _seq columns for time stamp and duration. The To: and Cc: fields should be valid address lists, Subject: will identify the email.
To send the email of data, press Send and ghabitat will use the system specific email command to dispatch the data. The progress of the operation is shown in a status line above the buttons. The window stays up to deal with any problems and can be dismissed with the Finished button.
External Tools
The data sent by e-mail above can also be forwarded to an external application, such as a spreadsheet application or other visualisation package. Select this features with View->Send Data to Application... from the menu bar. Data is sent using a pipe to stdin or the launched application.
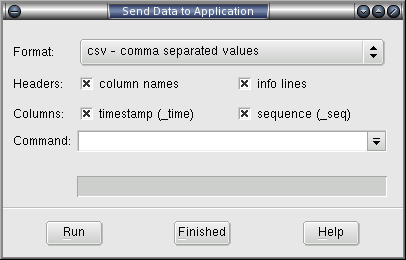
The data fields are identical to the e-mail pop-up above, with the exception of command: which should be a standard command line valid on the host system. Progress will appear in the status line above the buttons and the pop-up is dismissed with the Finished button.
Interchange Files
Data from ghabitat may be simply exported to a file, using the pop-up selected by View->Save Viewed Data...

Data is written to a file name with the Save button, showing the progress in the status bar and dismissing the pop-up with the Finished button.
Data Files
Several type of data file that may be read and written in ghabitat. This section details the operations that can be carried out with them.
Saving Data in Files
Currently, two basic formats may be saved: Fat Headed Arrays (FHA) and Comma Separated Values (CSV). However, each can be modified to look similar to each other by customising the headers or columns. The major difference between the two is that the FHA's values are separated by a single tab character (\t or ^I) not a comma.
Data should first be selected from the choice tree and scoped using the time scales. Regardless of the curves or instances being saved, all data covering that time will be used. Then three options are available to save data, all access from the menu bar.
View->Save Viewed Data...
View->Send Data to Application...
View->Send Data via E-mail...
Each of these options provide the opportunity to customise the appearance of the written data, then ask for specific ways in which to output. These forms are shown and described in the sections above.
Opening Data Files
Files may be opened for browsing using the File->Open... option from the menu bar or Add->File... when clicking the right mouse button over a node, resulting in the appearance of the file chooser pop-up. An attempt is made to load the file using several different formats, starting with the one containing the most information, moving to the next one if the load fails.
The following formats are supported:
|
Ringstore |
Conventionally end in .rs and contain many rings of time store data. The rings will appear under the file name label in the choice tree |
|
FHA |
Fat Headed Array is an enriched version of a CSV files and is treated as a single ringed data source. The files conventionally have the extension .fha. |
|
CSV |
Comma Separated Value files are treated as single ringed data sources. The files should conventionally end in .csv and the alternative .tsv if the values are tab (\t or ^I) separated. |
|
Text |
If ghabitat is unable to scan the input file as a table, it will treat the contents as plain text and allow its simple visualisation. |
All files read in this way will have an entry created for them under my files in the choice tree. Each file types gets a different icon to help distinguish the types.
Closing Data Files
To close a file of any type, select File->Close... from the menu bar, or click right over the node in the choice tree and select Remove.... This will display a file de-selection window, containing existing file loads.

Click on the line containing the file to remove and then the Close button. This will remove the file from the choice tree and dismiss the window from view.
Data Access from Peer Hosts
Data from other instances of habitat running on other hosts may be mapped into the choice tree, in addition to local data (under the node this host) and file sources (under my files). Several of these options are also explored in the section 'Finding Data Sources' earlier in this manual.
Peer Data over Filesystem
In addition to historic or experimental data, files may also contain dynamic data that are periodically updated from clockwork instances or direct insertions (from habput for example). If data is created by other systems, then the information may be shared using a file sharing protocol such as NFS or CIFS (SMB). The producer writes to the file on their system, the data is held on a file server and ghabitat on another system reads it.
Data created in this way are loaded in ghabitat like static files, using the menu bar's File->Open... (or choice tree's Add->File...) and made available under the label my files. They are removed using File->Close... (or Remove...). File based dynamic data can only be stored in a ringstore format.
This method of access is useful, but can suffer from bottlenecks due to file locking. When the produce stores the data, the file will be locked momentarily. Similarly, then the reader access the file, it is unavailable for writing. Consequently, it is most useful for slower data collection or infrequent ad-hoc use.
Peer Data over Network
The recommended way to access data from peer systems, is by network which uses an http based protocol. From ghabitat, remote systems can be attached by using the option File->Host... from the menu bar or by clicking right in the choice tree and selecting Add->Host.... From the pop-up (shown below), type the network host name and select the direct option.

This will attach the storage to the choice tree under the my hosts node. From here one can navigate the choices like it was on the local machine.
Data from Repository
The disadvantage with direct access is that the machine subject to monitoring will have to spend part of its time servicing the clients that have asked for performance data. Instead a more considerate option is to query the repository instead, which obtains data indirectly from the host. The current repository is provided by System Garden Harvest, and is an archive of Habitat's replicated feeds augmented with directly imported data and computed information. The use of a repository is advised for medium or larger sites.
Repository data is attached in the same way as direct access above, except that the repository button should be selected. Again, the host is placed in the choice tree under the my hosts node.
Graphical Viewer Information & Configuration
The graphical tool itself is configurable and uses the same system of control as other tools in the habitat suite. This section shows how configuration is used by the viewer and how to display information on this and the state of the ghabitat application.
Configuration Files
All habitat programs read the same set of configuration files before they start, and for most users the ~/.habrc file is the most convenient to use.
(Configuration may also be set on the command line and by administrators at multiple levels, which may account for behaviour not requested by a user. For more information of the global configuration of habitat and how to control it, see the Administration Manual.)
The first line in ~/.habrc is the magic number (actually a string) that identifies the format: it must be set to habitat 1 to show habitat its version. The remainder of the file contains settings in the form of simple assignments against property names. The values may be lists, single values and an implied positive or negative.
The following are the possible formats accepted by the configuration:
-
# blah blah blah
Comments are introduced with '#' and finish at the end of the line; they may follow any directive
Prop
Prop is set to true (1)
+Prop
Prop is set to -1
Prop val
Prop is set to val
Prop=val
Prop is set to val
Prop val1 val2 val3
Prop is set to the array (val1 val2 val3)
Care should be taken when manually changing the file, as the ghabitat application will also write to the file when exiting or carrying out configuration tasks. To be safe, it is advisable to edit the file when ghabitat is not running. If that is not possible, you should save the contents before ghabitat exits or before it starts. The application will only update the lines that match the property being updated, leaving everything else alone (comments, user settings, etc).
Some common values are shown in the Administration Manual. You may be asked to add values on the advice of an administrator or System Garden support.
Data Source History
When ghabitat exits normally, it edits the personal preference file .habrc in the user's home directory (~/.habrc). This information is used to reload files and hosts on a later invocation of ghabitat. It updates the lines containing the following keys:
|
ghchoice.myfiles.load |
The list of files that should be loaded the next time ghabitat is started |
|
ghchoice.myfiles.list |
The list of files that should be provided for convenience in a pull-down menu when selecting files |
|
ghchoice.myhosts.load |
The list of hosts that should be loaded the next time ghabitat is started |
|
ghchoice.myhosts.list |
The list of hosts that should be provided for convenience in a pull-down menu when selecting files |
All other lines are left alone, allowing them to be used for personal configuration (see section below).
Currently, if ghabitat is terminated abnormally, then the configuration file is not updated.
Viewing Current Configuration
Under the choice label this client will be three choices: configuration, log routes and logs. This cluster of choices shows the current state of the ghabitat viewing tool, as shown in the image below.

Selecting this client->configuration from the choices will display the current configuration of the client in the visualisation area to the right. Configurations are compiled from several sources and are a mixture of personal preference and system-wide directives augmenting ghabitat's internal settings. The mechanism is discussed in an appendix in this document and also in the Administration manual.
Configurations are displayed in a three column table: name, argument and value. For scalar values (for example, a single string or integer) the argument value is blank. However, when values are arrays, multiple rows are used with the same name and the argument column is used to distinguish between them. An example configuration is shown below.
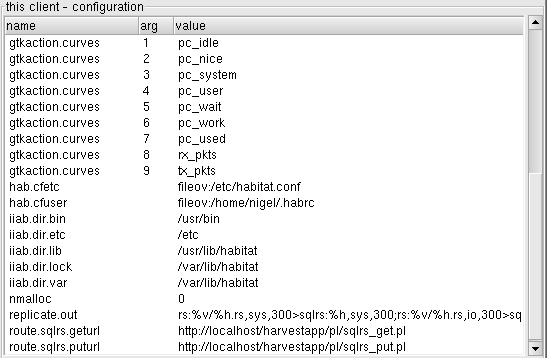
In the example, the directive gtkaction.curves has a nine element array as a value: pc_idle, pc_nice, pc_system, ... etc.
The specific configuration of ghabitat is also available by running the application with the diagnostic (-d) or debug (-D) mode on the command line. In these modes, logging is set to be more verbose (diag or debug level) and output sent to stderr, which is overridden from the normal settings. The ghabitat manual page in the appendix has more information.
